
SMIS: The Benefits of Inputting Detailed Cause Information
Because of this, the 10 incident factors were developed. They are geared towards identifying the broader, system-wide weaknesses that may contribute to an adverse event.
The 10 incident factors are now joined by a framework of human performance factors, as set out in the rail industry’s investigation standard, RIS-3119-TOM. The best way to see how these elements can help prevent accident recurrence is with a case study. In this short article, we present two: one from the freight sector and one from the passenger sector.
Case Study One: Freight
GB Railfreight (GBRf) has been inputting detailed cause information into SMIS for safety events since January 2019.
But what does this look like in reality? At the time of publication, the causes for 127 GBRf events have been entered, events that range from slips, trips and falls to SPADs and derailments. These events in turn have mapped on to 338 causal factors.
When the 10 incident factors were analysed across all events, the most common categories were infrastructure, vehicles, equipment and clothing (IVEC), risk management, and competence management (Figure 1).
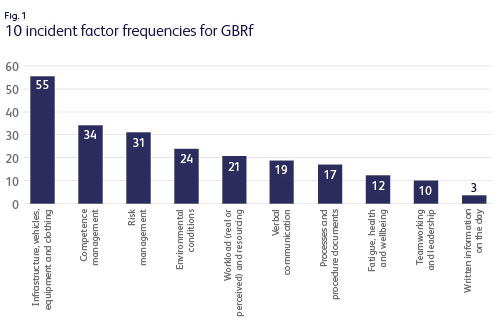
Figure 1 - 10 incident factor frequencies for GB Railfreight
The cause data from SMIS becomes richer the deeper as you dive into the analysis. For example, when you look at the cause profiles by event type, you see different 10 incident factor categories featuring more heavily. So, for SPADs, competence management is the most prevalent of the 10 incident factors, whilst IVEC issues are the most common for slips trips and falls (STFs) and derailments (Table 2). Analysis of the human performance factors also shows that looking at the cause profile by event type is beneficial. For example, decision errors are more prevalent for train derailments but intentional rule breaking causes are higher for railway operating incidents.
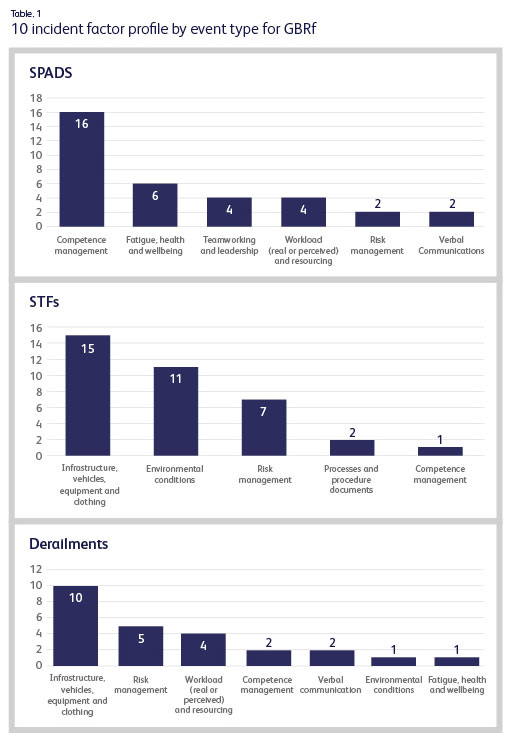
Table 1: 10 Incident factor profile by event type for GBRf
The detailed cause data in SMIS includes factor descriptions that provide additional detail and context. Table 2 below shows some example factor descriptions for the causal factors extracted from SMIS.
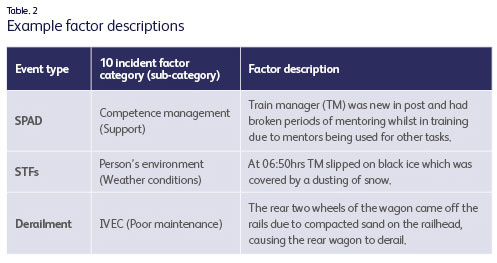
Table 2 - Example factor descriptions
Case Study Two: Passenger
The operations standards team at Greater Anglia (GA) has also been inputting cause information into SMIS for some of their key operational incidents since 2019. So far, the company has inputted causes for 49 events across SPADs (22), railway operating incidents (13), train-track control system brake applications or faults (12), and train collisions (2). A total of 165 causes have been identified across these events, an average of 3.4 causes per event.
Of the 165 causes identified, 94 (57%) were 10 incident factors and 71 (43%) were human performance factors.
The most common 10 incident factor groups across all event types were competence management (25), workload and resourcing (17) infrastructure, vehicles, equipment and clothing (14), fatigue, health and wellbeing (11), and processes and procedure documents (8) (Figure 2).
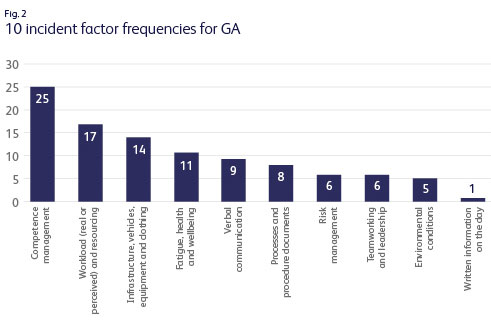
Figure 2 -10 incident factor frequencies for Greater Anglia
When you look at the 10 incident factor profile for each event type, in the same way as for GBRf, different themes emerge with different groupings dominating (Table 3). It can be seen that competence management factors are in the top three of all event types shown in Table 2, so competence management issues would be a good area for GA to focus on.
When it comes to the human performance factors, the majority (58%) were slips and lapses, while 34% were decision errors. Of the slips and lapses, factors including distraction and forgetting featured highly.
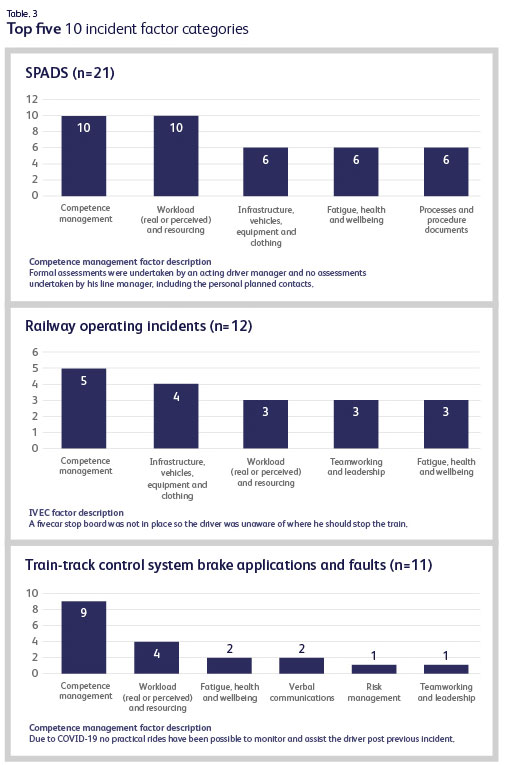
Table 3 - Top five 10 incident factor categories
'After each incident we capture the causal factors on a central spreadsheet to identify common trends within the 10 incident factors. Competence management was identified in several incidents due to drivers/trainees being unable to travel in the driving cab for assessment during the COVID-19 pandemic. This coincided with our simulators being replaced, in line with the introduction of our new fleet. As a result, many trainees did not have simulator experience before passing as competent train drivers. We instructed all assessors to follow up any replacement assessments carried out via download through a socially distanced one-to-one or by telephone. Additionally, we established a process whereby newly qualified and at-risk drivers would be prioritised for simulator sessions upon their reintroduction. By introducing this method, we achieved a reduction in operational incidents particularly among newly qualified drivers during the latter stages of the pandemic.
Vehicle and infrastructure issues also highlighted several wrong side door releases that were caused due to the setup of on-board CCTV Driver Only Operation (DOO) equipment. The design issue was factored out with support from the manufacturers to stop this incident type.
GA has acquired support to assist in further developing non-technical skills (NTS), with the view of combatting the data regarding human performance factors. One-to-one coaching sessions are used with high-risk drivers, and driver managers are being upskilled on their NTS knowledge. These sessions have been used to get input from driver managers into how we can better integrate NTS within an assessment. The next phase for GA is to establish an NTS leadership team to implement a structure to further implement the NTS approach.'