Rail Emissions and Air Quality Mapping
A rail specific online air quality mapping tool has been developed to provide an up-to-date and improved resolution mapping of rail emissions (PM10, PM2.5, NO2). The mapping tool is hosted on an online portal to allow industry stakeholders to interactively view estimated rail emissions across the network.
Air quality is a significant public health issue, with the transport sector being a major contributor to emissions. Traditionally in the rail sector, emissions have been mapped at a low resolution with emissions averaged over large distances. This provided very limited data on where localised poor air quality hotspots exist.
Estimating the geographical spread of emissions so policies and interventions can be targeted appropriately will be a significant step in tackling poor air quality. RSSB’s project ‘CLEAR - Rail air quality mapping (T1186)’ led to the development of a rail-specific mapping tool to enable estimation of emissions on a local level and in more detail. RSSB’s Rail Emissions Mapping Tool allows users to develop mitigation measures at specific areas.
The tool is hosted on an online geographical information system (GIS) portal, which enables users to understand the emissions on a national and local level. Further enhancement projects are planned to build on the powerful database and explore additional insights that can be extracted.
To access the Rail Emissions Mapping Tool please contact AQMapping@rssb.co.uk
The Rail Emissions Mapping Tool
The tool provides better data on where emissions hotspots and associated risks are and enables users to better understand why hotspots exist and what can be done to improve air quality at these locations. It provides a clear picture of rail emissions for a specific location, section of railway line (Inter TIPLOC Segment), route, or geographical area.
Simple controls can be used of the tool to view and inspect the data quickly and at a high level, as well as applying simple filters to perform analysis at a more granular level (such as filtering for a particular TOC). However, it is also possible for more detailed analysis to be undertaken either by creating bespoke filters or manipulating and then extracting specifically sorted data.
More specifically, the tool enables user to complete tasks such as:
- viewing rail emissions (of NOX, PM10 and PM2.5) in a particular area of the GB rail network
- finding rail segments with the highest emissions
- filtering the data by specific information such as train operating company (TOC), train group, train class, emission category, emission type and propulsion type
- viewing an Air Quality Management Area or Clean Air Zone and its associated data
- extracting and download data for use outside the tool
- easily and interactively communicate findings to stakeholders
- visually track ongoing improvements geographically
- forecast future emissions.
Key findings
The revised distance-based emission factors derived are a significant improvement over those provided by the previous version of the National Atmospheric Emissions Inventory. On average, the total emissions calculated are also more robust and accurate.
At locations where there are idling or slow-moving trains (for example near stations or depots), notch-based emissions factors will provide more accurate predictions of the higher emissions levels that these situations generate.
The emission estimates can potentially be used with DfT transport analysis guidance (TAG) rail emission costs to inform the business case for transport investment proposals that affect air quality. While the economic benefits of improvements in air quality are unlikely to outweigh the costs of electrification schemes, incorporating such benefits into the overall cost-benefit analysis could potentially improve their business case.
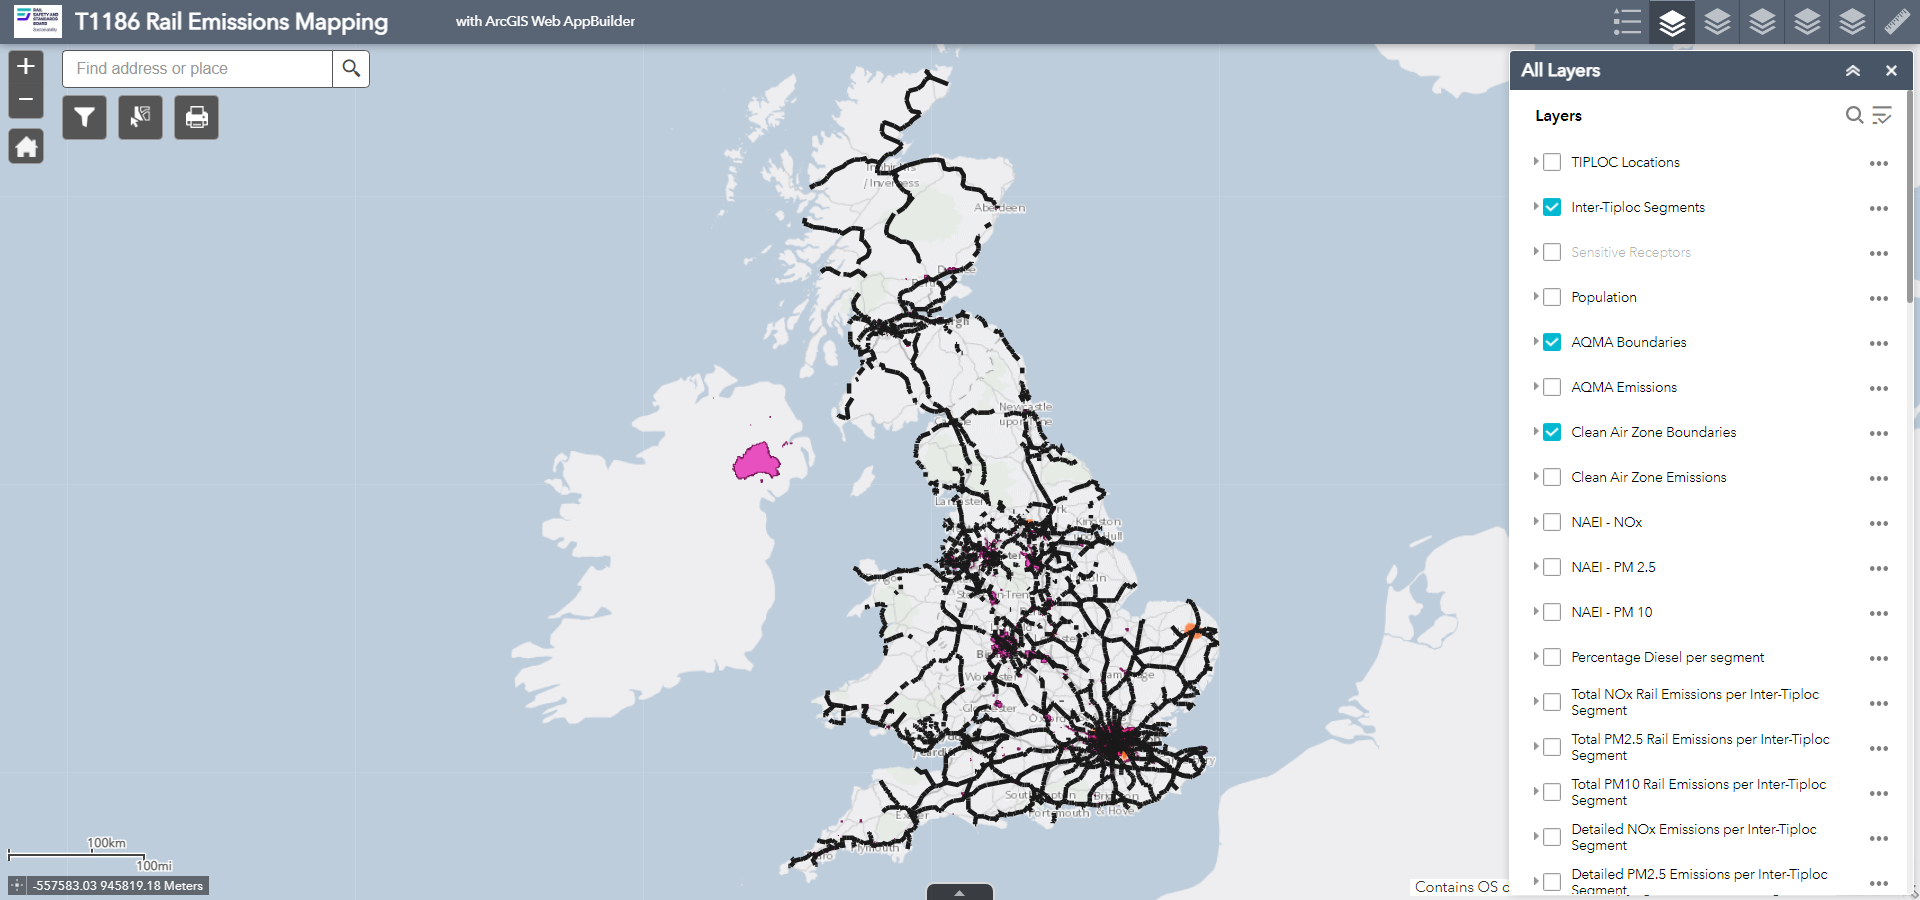
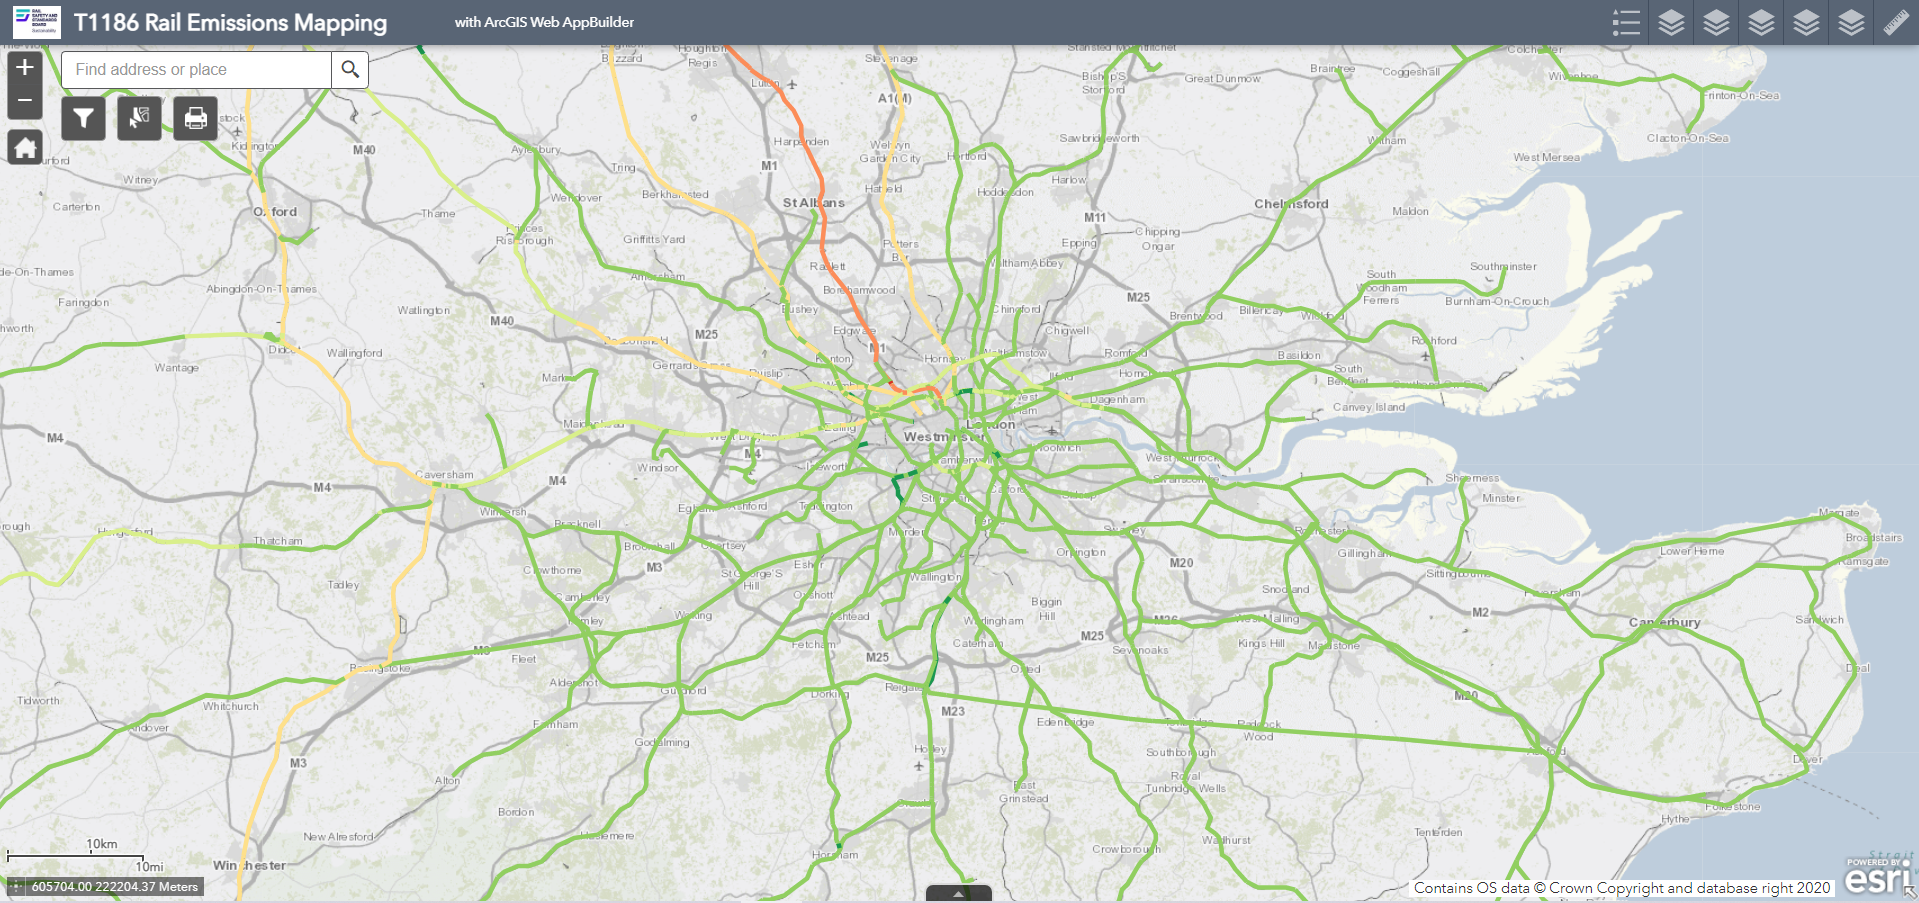
Illustration of total NOx emissions along train routes